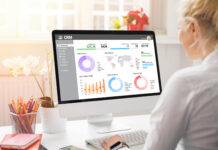
Data dashboards have emerged as indispensable tools for businesses and organizations across the globe. As we step into 2023, let’s explore the most powerful data dashboards that are poised to reshape the way we visualize and understand data.
The Evolution of Data Dashboards
Data dashboards have come a long way from their humble beginnings. Initially, they were rudimentary tools that displayed basic charts and graphs. Today, they are sophisticated platforms capable of aggregating, analyzing, and visualizing vast datasets in real time. This evolution has been driven by advancements in technology, increased data availability, and the growing demand for data-driven decision support.
The Power of Interactive Visualization
One of the defining features of modern data dashboards is their interactivity. Users can drill down into data, filter information based on specific criteria, and even predict future trends using machine learning algorithms. This level of interactivity empowers decision-makers to extract valuable insights quickly.
The Most Powerful Data Dashboards of 2023
1. Tableau
Tableau has long been a leader in the data visualization space. In 2023, it continues to impress with its user-friendly interface, extensive library of data connectors, and advanced analytics capabilities. Tableau’s ability to create interactive dashboards remains a hallmark of its success.
- User-Friendly Interface: Tableau’s user-friendly interface remains a standout feature. It empowers users of all skill levels to create meaningful and interactive data visualizations without the need for extensive coding or technical expertise.
- Extensive Data Connectors: Tableau boasts an extensive library of data connectors that enable seamless integration with various data sources. This flexibility ensures that users can access and visualize data from multiple platforms and databases.
- Advanced Analytics Capabilities: Tableau’s analytics capabilities have evolved, allowing users to perform advanced statistical analyses, predictive modeling, and machine learning within the platform. This empowers organizations to uncover deeper insights from their data.
- Interactive Dashboards: Tableau’s ability to create interactive dashboards remains a hallmark of its success. Users can easily drill down into data, apply filters, and perform ad-hoc analyses, making it a preferred choice for businesses seeking actionable insights.
2. Power BI
Microsoft’s Power BI has gained significant traction in recent years. Its robust integration with other Microsoft products, AI-powered features, and expansive data modeling capabilities make it a powerhouse in the dashboard arena.
- Robust Integration: Power BI seamlessly integrates with other Microsoft products, such as Excel and Azure, providing a unified ecosystem for data analysis and visualization. This integration makes it particularly appealing to organizations that rely on Microsoft’s suite of tools.
- AI-Powered Features: Power BI leverages artificial intelligence (AI) and machine learning to enhance data analysis. Users can benefit from automated insights, natural language querying, and predictive analytics, enabling faster decision-making.
- Expansive Data Modeling: Power BI offers extensive data modeling capabilities, allowing users to create complex data relationships and hierarchies. This flexibility is invaluable for businesses with diverse and intricate datasets.
3. QlikView
QlikView is known for its associative data model, which enables users to explore data relationships intuitively. Its in-memory processing and associative analytics empower users to uncover hidden insights effortlessly.
- Associative Data Model: QlikView is known for its associative data model, which enables users to explore data relationships intuitively. This allows for dynamic data exploration, making it easier to uncover hidden insights.
- In-Memory Processing: The platform’s in-memory processing capabilities ensure that data retrieval and analysis are lightning-fast. Users can work with large datasets without experiencing performance bottlenecks.
- Associative Analytics: QlikView’s associative analytics allow users to navigate data associations effortlessly. This not only simplifies data discovery but also encourages users to ask more questions and explore data more deeply.
4. Domo
Domo stands out for its cloud-native architecture and emphasis on collaboration. It offers a wide array of pre-built connectors and applications that streamline data integration and visualization.
- Cloud-Native: Domo’s cloud-native architecture offers the advantage of scalability and accessibility. Users can access their data and dashboards from anywhere, promoting real-time collaboration and decision-making.
- Collaboration Emphasis: Domo places a strong emphasis on collaboration, making it easy for teams to work together on data analysis and visualization projects. This fosters a culture of data-driven decision-making within organizations.
- Pre-built Connectors and Applications: Domo offers a wide array of pre-built connectors and applications that simplify data integration and visualization. This feature accelerates the time it takes to turn raw data into actionable insights.
5. Looker
Looker focuses on data exploration and modeling. Its unique LookML language simplifies the process of defining data models, making it an ideal choice for organizations with complex data structures.
- LookML Language: Looker’s unique LookML language simplifies the process of defining data models. This makes it an ideal choice for organizations with complex data structures. Users can create and maintain data models more efficiently.
- Data Exploration: Looker encourages data exploration through its intuitive interface. Users can create and share reports and dashboards, allowing teams to collaborate on data analysis projects effortlessly.
6. Sisense
Sisense is renowned for its scalability and ability to handle large datasets. Its In-Chip analytics technology accelerates data processing, enabling rapid insights.
- Scalability: Sisense excels in handling large datasets and is designed to scale with an organization’s growing data needs. This makes it suitable for enterprises with extensive and diverse data sources.
- In-Chip Analytics: Sisense’s In-Chip analytics technology accelerates data processing by leveraging the power of in-memory computing. This results in faster insights, even when dealing with massive datasets.
7. Google Data Studio
Google Data Studio is a free, cloud-based platform that offers strong collaboration features. It seamlessly integrates with other Google products, making it a popular choice for organizations already invested in the Google ecosystem.
- Cloud-Based and Free: Google Data Studio is a cost-effective choice as it is free to use. It provides organizations with a budget-friendly option for data visualization.
- Integration with Google Products: The platform seamlessly integrates with other Google products, such as Google Analytics and Google Sheets. This makes it a popular choice for organizations already invested in the Google ecosystem.
The Future of Data Dashboards
As we look ahead, several trends are likely to shape the future of data dashboards:
AI and Machine Learning Integration
Expect to see deeper integration of AI and machine learning algorithms into data dashboards, enabling predictive and prescriptive analytics.
Augmented and Virtual Reality Dashboards
The adoption of augmented and virtual reality technologies may lead to immersive data dashboards that allow users to visualize data in 3D environments.
Real-time Data Streaming
Dashboards will continue to evolve to accommodate real-time data streaming, facilitating instant decision-making.
Enhanced Data Security
With the growing importance of data privacy, data dashboards will incorporate enhanced security measures to protect sensitive information.
Simplify Data-Driven Decisions With the Right Dashboard
Data dashboards have become indispensable tools for businesses and organizations seeking to leverage data for informed decision-making. The most powerful data dashboards of 2023, equipped with interactive features and advanced analytics capabilities, are poised to empower decision-makers like never before. As technology continues to advance, we can anticipate even more innovative and immersive data dashboard solutions in the years ahead, revolutionizing the way we visualize and harness the power of data.


